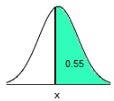
|
Accounting | Business | Computer Science | General Studies | Math | Sciences | Civics Exam | Help/Support | Join/Cancel | Contact Us | Login/Log Out Elementary Statistics Homework 1 2 3 4
5-6 6.3-7
8-10 | Tests Chapter 1-3
4 5-6 6.3-7 8-10 Final Review
Elementary Statistics
(STA2023)
Homework 5 - 6 The binompdf function on your calculator
is for finding the probability of exactly some number of
successes.
(binompdf = n, p, c) for some number c.  TI84 Plus Instructions Press 2ND | VARS 1 - normalpdf 2 – normalcdf 3 – invNorm 4 The table to the right lists probabilities for the corresponding numbers of girls in three births. What is the random variable, what are its possible values, and are its values numerical? Number_of_girls P(x) 0 0.125 1 0.375 2 0.375 3 0.125 Choose the correct answer below. A. The random variable is P(x), which is the probability of a number of girls in three births. The possible values of P(x) are 0.125 and 0.375. The values of the random value P(x) are numerical. B. The random variable is x, which is the number of girls in three births. The possible values of x are 0, 1, 2, and 3. The values of the random value x are numerical. C. The random variable is P(x), which is the probability of a number of girls in three births. The possible values of P(x) are 0.125 and 0.375. The values of the random value P(x) are not numerical. D. The random variable is x, which is the number of girls in three births. The possible values of x are 0, 1, 2, and 3. The values of the random value x are not numerical. Is the random variable given in the accompanying table discrete or continuous? Explain. Number of Girls, x P(x) 0 0.063 1 0.25 2 0.375 3 0.25 4 0.063 The random variable given in the accompanying table is ___ because ___ discrete, there are a finite number of values A variable is a quantity whose value changes. A discrete variable is a variable whose value is obtained by counting. Examples: number of students present. number of red marbles in a jar number of heads when flipping three coins students’ grade level A continuous variable is a variable whose value is obtained by measuring. Examples: height of students in class weight of students in class time it takes to get to school. distance traveled between classes. Determine whether the value is a discrete random variable, continuous random variable, or not a random variable. a. The weight of a Upper T dash bone steak b. The number of points scored during a basketball game c. The eye color of people on commercial aircraft flights d. The number of people with blood type Upper A in a random sample of 47 people e. The square footage of a house f. The height of a randomly selected giraffe a. Is the weight of a Upper T dash bone steak a discrete random variable, a continuous random variable, or not a random variable? A. It is a discrete random variable. B. It is a continuous random variable. C. It is not a random variable. b. Is the number of points scored during a basketball game a discrete random variable, a continuous random variable, or not a random variable? A. It is a discrete random variable. B. It is a continuous random variable. C. It is not a random variable c. Is the eye color of people on commercial aircraft flights a discrete random variable, a continuous random variable, or not a random variable? A. It is a continuous random variable. B. It is a discrete random variable. C. It is not a random variable. d. Is the number of people with blood type Upper A in a random sample of 47 people a discrete random variable, a continuous random variable, or not a random variable? A. It is a continuous random variable. B. It is a discrete random variable. C. It is not a random variable. e. Is the square footage of a house a discrete random variable, a continuous random variable, or not a random variable? A. It is a continuous random variable. B. It is a discrete random variable. C. It is not a random variable. f. Is the height of a randomly selected giraffe a discrete random variable, a continuous random variable, or not a random variable? A. It is a continuous random variable. B. It is a discrete random variable. C. It is not a random variable. Five males with an X-linked genetic disorder have one child each. The random variable x is the number of children among the five who inherit the X-linked genetic disorder. Determine whether a probability distribution is given. If a probability distribution is given, find its mean and standard deviation. If a probability distribution is not given, identify the requirements that are not satisfied. x P(x) 0 0.034 1 0.145 2 0.321 3 0.321 4 0.145 5 0.034 Does the table show a probability distribution? Select all that apply. A. Yes, the table shows a probability distribution. B. No, the random variable x is categorical instead of numerical. C. No, not every probability is between 0 and 1 inclusive. D. No, the sum of all the probabilities is not equal to 1. E. No, the random variable x's number values are not associated with probabilities. Find the mean of the random variable x. Select the correct choice below and, if necessary, fill in the answer box to complete your choice. A. mu 2.5 child(ren) (Round to one decimal place as needed.) B. The table does not show a probability distribution. x P(x) 0 x 0.034 0 1 x 0.145 0.145 2 x 0.321 0.642 3 x 0.321 0.963 4 x 0.145 0.58 5 x 0.034 0.17 Mean = 2.5 Please note to find the mean from L1, you will need to use L2 in the FreqList. Just to be sure, go to: STAT > CALC > 1-Var Stats and FreqList: hit 2ND and the number 2.   STAT EDIT LINE ENTER DATA/NUMBERS in L1 & L2 Then STAT CALC VAR STATS CALCULATE x̅ = Mean Find the standard deviation of the random variable x. Select the correct choice below and, if necessary, fill in the answer box to complete your choice. A. sd = 1.1 child(ren) (Round to one decimal place as needed.) B. The table does not show a probability distribution. x P(x) x^2 0 0.034 0 x = 0 1 0.145 1 x = 0.145 2 0.321 4 x = 1.284 3 0.321 9 x = 2.889 4 0.145 16 x = 2.32 5 0.034 25 x = 0.85 7.488 Please note to find the mean from L1, you will need to use L2 in the FreqList. Just to be sure, go to: STAT > CALC > 1-Var Stats and FreqList: hit 2ND and the number 2.   STAT EDIT LINE ENTER DATA / NUMBERS in L1 & L2 STAT CALC VAR STATS CALCULATE σx = standard deviation https://www.mathportal.org/calculators/statistics-calculator/probability-distributions-calculator.php
x P(x)
0 0.001
1 0.008
2 0.028
3 0.063
Does the
table show a probability distribution? Select all that apply.
A. Yes,
the table shows a probability distribution.
B. No,
the random variable x is categorical instead of numerical.
C. No,
the random variable x's number values are not associated with probabilities.
D. No,
the sum of all the probabilities is not equal to 1.
E. No,
not every probability is between 0 and 1 inclusive
Find the
mean of the random variable x. Select the correct choice below and, if
necessary, fill in the answer box to complete your choice.
A. mu =
women (Round to one decimal place as needed.)
B. The
table does not show a probability distribution.
x P(x)
0 0.001 0
1 0.008 0.008
2 0.028 0.056
3 0.063 0.189
Mean = 0.253
Find the
standard deviation of the random variable x. Select the correct choice below
and, if necessary, fill in the answer box to complete your choice.
A. SD =
women (Round to one decimal place as needed.)
B. The
table does not show a probability distribution.
A sociologist randomly selects single adults for different groups
of three, and the random variable x is the number in the group who say that
the most fun way to flirt is in person. Determine whether a probability
distribution is given. If a probability distribution is given, find its mean
and standard deviation. If a probability distribution is not given, identify
the requirements that are not satisfied.
x P(x)
0 0.086
1 0.331
2 0.428
3 0.155
Does the table show a probability distribution? Select all that
apply.
A. Yes, the table shows a probability distribution.
B. No, not every probability is between 0 and 1 inclusive.
C. No, the random variable x's number values are not associated
with probabilities.
D. No, the random variable x is categorical instead of numerical.
E. No, the sum of all the probabilities is not equal to 1.
Find the mean of the random variable x. Select the correct choice
below and, if necessary, fill in the answer box to complete your choice.
A. mu = 1.7 adult(s) (Round to one decimal place as
needed.)
B. The table does not show a probability distribution.
x P(x)
0 x 0.086 0
1 x 0.331 0.331
2 x 0.428 0.856
3 x 0.155 0.465
mean =
1.652 (1.7 rounded)
Please note to find the mean from
L1, you will need to use L2 in the FreqList.
Just to be sure, go to: STAT >
CALC > 1-Var Stats and FreqList: hit 2ND
and the number 2.
 
STAT
CALC
x̅ =
Mean
Find the standard deviation of the random variable x. Select the
correct choice below and, if necessary, fill in the answer box to complete
your choice.
A. SD = 0.8 adult(s) (Round to one decimal place as
needed.)
B. The table does not show a probability distribution
x P(x) x^2
0 0.086 0 0
1 0.331 1 0.331
2 0.428 4 1.712
3 0.155 9 1.395
3.438
Please note to find the mean from
L1, you will need to use L2 in the FreqList.
Just to be sure, go to: STAT >
CALC > 1-Var Stats and FreqList: hit 2ND
and the number 2.
 
STAT
EDIT ENTER DATA / NUMBERS in L1 & L2 STAT
CALC
VAR STATS CALCULATE
σx = standard
deviation
The accompanying table describes results from groups of 10 births
from 10 different sets of parents.
The random variable x represents the number of girls among 10 children. Use the range rule of thumb to determine whether 1 girl in 10 births is a significantly low number of girls.
x P(x)
0 0.004
1 0.019
2 0.038
3 0.113
4 0.195
5 0.239
6 0.206
7 0.117
8 0.037
9 0.015
10 0.017
Use the range rule of thumb to identify a range of values that are
not significant.
The maximum value in this range is 8.5 girls.
(Round to one decimal place as needed.)
 TI84 Plus Instructions TI84 Plus Instructions
Stat
Edit enter data in L1 and L2 stat var stats list L1
Maximum
The minimum value in this range is 1.7 girls.
Minimum Value = μ − 2σ
Based on the result, is 1 girl in 10 births a significantly low
number of girls? Explain.
C. Yes, 1 girl is a significantly low number of girls, because 1
girl is below the range of values that are not significant.
The accompanying table describes results from groups of 8 births
from 8 different sets of parents.
The random variable x represents the number of girls among 8 children. Complete parts (a) through (d) below.
Number of Girls x P(x)
0 0.004
1 0.038
2 0.113
3 0.186
4 0.318
5 0.186
6 0.113
7 0.038
8 0.004
a. Find the probability of getting exactly 6 girls in 8 births. 0.113
(Type an integer or a decimal. Do not round.)
b. Find the probability of getting 6 or more girls in 8 births. 0.155
(Type an integer or a decimal. Do not round.)
0.113 + 0.038 + 0.004 = 0.155
c. Which probability is relevant for determining whether 6 is a
significantly high number of girls in 8 births:
the result from part (a) or part (b)?
A. The result from part a, since it less than the probability of the given or more extreme
result.
B. The result from part a, since it is the exact probability
being asked.
C. The result from part b, since it is the complement of the
result of part a.
D. The result from part b, since it is
the probability of the given or more extreme result.
d. Is 6 a significantly high number of girls in 8 births? Why or
why not?
Use 0.05 as the threshold for a significant event.
A. Yes, since the appropriate probability is less than 0.05, it
is a significantly high number.
B. Yes, since the appropriate probability is greater than 0.05,
it is a significantly high number.
C. No, since the appropriate probability is greater than 0.05,
it is not a significantly high number.
D. No, since the appropriate probability is less than 0.05, it
is not a significantly high number.
Refer to the accompanying table, which describes the number of
adults in groups of five who reported sleepwalking.
Find the mean and standard deviation for the numbers of sleepwalkers in groups of five.
x P(x)
0 0.192
1 0.354
2 0.295
3 0.129
4 0.027
5 0.003
The mean is 1.5 sleepwalker(s). (Round to one decimal
place as needed.)
The standard deviation is sleepwalker(s). 1.0
(Round to one decimal place as needed.)
 TI84 Plus Instructions TI84 Plus InstructionsStat
Edit enter data in L1 and L2 stat var stats list L1
A _____ random variable has either finite or countable number of
values
Discrete
A _______ random variable has infinitely many values with
measurements
Continuous
The _____ of a discrete random variable represents the mean value
of the outcomes
Expected value
A sociologist randomly selects single adults for different groups
of three, and the random variable x is the number in
the group who say that the most fun way to flirt is in person. Determine whether a probability distribution is given. If a probability distribution is given, find its mean and standard deviation. If a probability distribution is not given, identify the requirements that are not satisfied.
x P(x)
0 0.087
1 0.329
2 0.423
3 0.161
Does the table show a probability distribution? Select all that
apply.
A. Yes, the table shows a probability distribution.
B. No, the random variable x is categorical instead of numerical.
C. No, the sum of all the probabilities is not equal to 1.
D. No, the random variable x's number values are not associated
with probabilities.
E. No, not every probability is between 0 and 1 inclusive
Find the mean of the random variable x. Select the correct choice
below and, if necessary,
fill in the answer box to complete your choice.
A. mu = 1.7 adult(s) (Round to one decimal place as
needed.)
B. The table does not show a probability distribution.
x P(x)
0 0.087 0
1 0.329 0.329
2 0.423 0.846
3 0.161 0.483
1.658
or 1.7
Find the standard deviation of the random variable x. Select the
correct choice below and,
if necessary, fill in the answer box to complete your choice.
A. SD = .8
adult(s) (Round to one decimal place as needed.)
B. The table does not show a probability distribution
x P(x) X2
0 0.087 0 x 0.087 0
1 0.329 1 x 0.329 0.329
2 0.423 4 x 0.423 1.692
3 0.161 9 x 0.161 1.449
3.47
 TI84 Plus Instructions TI84 Plus Instructions2nd + X2
3.47 – 1.6582 = 0.8491383868 or 0.8
Use STAT on TI-84 Plus to find the standard deviation
and round it to one decimal.
Use the first two columns.
Calc Var Stats
Homework 5.2
Based on a survey, assume that 35% of consumers are comfortable
having drones deliver their purchases.
Suppose that we want to find the probability that when five consumers are randomly selected, exactly three of them are comfortable with delivery by drones. Identify the values of n, x, p, and q.
The value of n is 5 (five)
The value of x is 3 (three)
The value of p is .35
The value of q is 0.65
1 - 0.35 = 0.65
Determine whether the given procedure results in a binomial
distribution (or a distribution that can be treated as binomial). If the
procedure is not binomial, identify at least one requirement that is not
satisfied.
Seven different senators from the current U.S. Congress are
randomly selected without replacement and whether or not they've served over 2
terms is recorded. Does the probability experiment represent a binomial
experiment?
A. No, because there are more than two mutually exclusive
outcomes for each trial.
B. No, because the experiment is not
performed a fixed number of times.
C. No, because the trials of the experiment are not independent and the probability of success differs from
trial to trial.
D. Yes, because the experiment satisfies
all the criteria for a binomial experiment.
Assume
that a procedure yields a binomial distribution with n=6 trials and a
probability of success of
p = 0.30.
Use a
binomial probability table to find the probability that the number of successes
x = exactly 4.
Click on
the icon to view the binomial probabilities table.
P (4) = 0.060
 TI84 Plus Instructions TI84 Plus Instructions
Press
2ND VARS Binompdf: Trials: 6 P: 0.30 x value: 4 Enter, Enter = 0.059535 round to 0.060
Assume that random guesses are made for nine multiple choice
questions on an SAT test, so that there are n = 9 trials,
each with probability of success (correct) given by p = 0.4
Find the indicated probability for the number of correct answers.
Find the probability that the number x of correct answers is fewer than 4.
P (x < 4) = 0.4826
 TI84 Plus Instructions TI84 Plus InstructionsPress 2ND VARS
Binomcdf
Trails = 9 P: 0.4 X value = 3 (4 – 1 = 3)
= 0.482609664
Assume that random guesses are made for nine multiple choice
questions on an SAT test, so that there are n = 9 trials,
each with probability of success (correct) given by p = 0.45.
Find the indicated probability for the number of correct answers.
Find the probability that the number x of correct answers is fewer
than 4.
P(x < 4) = 0.3614
 TI84 Plus Instructions TI84 Plus Instructions2ND
VARS Binomcdf 9 0.45 3 (4-1) Highlight Paste Press Enter, Enter
= 0.3613846037
Assume that when adults with smartphones are randomly selected,
53% use them in meetings or classes.
If 8 adult smartphone users are randomly selected, find the probability that exactly 3 of them use their smartphones in meetings or classes.
The probability is 0.1912
 TI84 Plus Instructions TI84 Plus Instructions2ND
VARS binompdf 8 0.53 3
= 0.191207501
Assume that when adults with smartphones are randomly selected,
55% use them in meetings or classes.
If 7 adult smartphone users are randomly selected, find the probability that exactly 5 of them use their smartphones in meetings or classes.
The probability is 0.2140
(Round to four decimal places as needed.)
 TI84 Plus Instructions TI84 Plus Instructions2ND
VARS binompdf 7 0.55 5
= 0.2140216805
Assume that when adults with smartphones are randomly selected,
57 % use them in meetings or classes. If 5 adult
smartphone users are randomly selected, find the probability that at least 3 of them use their smartphones in meetings or classes.
The probability is 0.6295
(Round to four decimal places as needed.)
1 - 0.57 = 0.43
x value (5 – 3) = 2
 TI84 Plus Instructions
2ND
VARS Binomcdf 5 0.43 2 = 0.6295450842
Assume that when adults with smartphones are randomly selected,
57% use them in meetings or classes.
If 10 adult smartphone users are randomly selected, find the probability that at least 4 of them use their smartphones in meetings or classes.
The probability is 0.9194
P = 1 - .57 = .43
x value 10 - 4 = 6
 TI84 Plus Instructions TI84 Plus Instructions
2ND
VARS Binomcdf 10 .43 6 = 0.9194236892
Assume that when adults with smartphones are randomly selected,
56% use them in meetings or classes.
If 7 adult smartphone users are randomly selected, find the probability that at least 3 of them use their smartphones in meetings or classes.
The probability is
1 - 0.56 = 0.44
7 – 3 = 4
 TI84 Plus Instructions TI84 Plus Instructions
2ND
VARS Binomcdf: 7 0.44 4 = 0.8597552431
Which of the following is not a requirement of the binomial
probability distribution? Choose the correct answer below.
A. The probability of a success remains the same in all trials.
B. The trials must be dependent.
C. Each trial must have all outcomes classified into two
categories.
D. The procedure has a fixed number of trials.
A survey showed that 83% of adults need correction (eyeglasses,
contacts, surgery, etc.) for their eyesight. If 8 adults are randomly
selected, find the probability that at least 7 of them need correction for
their eyesight. Is 7 a significantly high
number of adults requiring eyesight correction?
The probability that at least 7 of the 8 adults require eyesight
correction is 0.594.
(Round to three decimal places as needed.)
p: (1 - .83) = 0.17
x value: 8 – 7 = 1
 TI84 Plus Instructions TI84 Plus Instructions
2ND
VARS Binomcdf 8 0.17 1
Is 7 a significantly high number of adults requiring eyesight
correction? Note that a small probability is one that is less than 0.05.
A. No , because the probability of this occurring is not small.
B. Yes , because the probability of this
occurring is small.
C. No , because the probability of this
occurring is small.
D. Yes , because the probability of this
occurring is not small.
A survey showed that 72% of adults need correction (eyeglasses,
contacts, surgery, etc.) for their eyesight. If 11 adults are randomly
selected, find the probability that no more than 1 of them need correction for
their eyesight. Is 1 a significantly low number of adults requiring eyesight
correction?
The probability that no more than 1 of the 11 adults require
eyesight correction is 0.00
P: 1 - .83 = 0.17
x value: 11 - 11 = 0

TI84 Plus Instructions
2ND
VARS Binomcdf 8 0.17 1 = 0.00
A survey showed that 82% of adults need correction (eyeglasses,
contacts, surgery, etc.) for their eyesight.
If 14 adults are randomly selected, find the probability that at least 13 of them need correction for their eyesight. Is 13 a significantly high number of adults requiring eyesight correction?
The probability that at least 13 of the 14 adults require eyesight
correction is 0.253
(Round to three decimal places as needed.)
P: 1 - .82 = .18
X value: 14 - 13 = 1
 TI84 Plus Instructions TI84 Plus Instructions2ND
VARS Binomcdf 14 0.18 1 = 0.2531200501
Is 13 a significantly high number of adults requiring eyesight
correction?
Note that a small probability is one that is less than 0.05.
No, because the probability of this occurring is not small
In the binomial probability formula, the variable x represents
the
number of successes.
Based on a poll, among adults who regret getting tattoos, 27%
say that they were too young when they got their tattoos.
Assume that nine adults who regret getting tattoos are randomly selected and find the indicated probability.
Complete parts (a) through (d) below.
a. Find the probability that none of the selected adults say that
they were too young to get tattoos.
0.0589
 TI84 Plus Instructions TI84 Plus InstructionsPress: 2ND VARS
9 0.27 0 = 0.0588715867
b. Find the probability that exactly one of the selected adults
says that he or she was too young to get tattoos.
0.1960
 TI84 Plus Instructions TI84 Plus Instructions2ND
VARS Binompdf 9 0.27 1 = 0.1959698023
c. Find the probability that the number of selected adults saying
they were too young is 0 or 1.
0.2548
 TI84 Plus Instructions TI84 Plus Instructions2ND
VARS Binomcdf 9 0.27 1 = 0.254841389
d. If we randomly select nine adults, is 1 a significantly low
number who say that they were too young to get tattoos?
No, because the probability that at most 1 of the selected
adults say that they were too young is greater than 0.05
a. What is
the probability that exactly 5 of the selected adults believe in
reincarnation?
The
probability that exactly 5 of the 6 adults believe in reincarnation is 0.187
 TI84
Plus TI84
Plus2ND
VARS Binompdf 6 0.6 5 = 0.186624
b. The
probability that all of the selected adults believe in
reincarnation is 0.047
 TI84
Plus TI84
Plus2ND
VARS Binompdf 6 0.6 6 = 0.046656
c. What is the probability that at least 5 of the selected adults
believe in reincarnation?
The probability that at least 5 of the selected adults believe in
reincarnation is 0.234
(Round to three decimal places as needed.)
0.187 + 0.047 = 0.234
If 6 adults are randomly selected, is 5 a significantly high
number who believe in reincarnation?
A. No because the probability that 5 or more of the selected
adults believe in reincarnation is greater than 0.05.
B. Yes because the probability that 5 or more of the selected
adults believe in reincarnation is less than 0.05.
C. Yes because the probability that 5 or more of the selected
adults believe in reincarnation is greater than 0.05.
D. No because the probability that 5 or more of the selected
adults believe in reincarnation is less than 0.05.
Assume that hybridization experiments are conducted with peas
having the property that for offspring, there is a 0.75 probability that a pea
has green pods. Assume that the offspring peas are randomly selected in groups
of 40 Complete parts (a) through (c)
below.
a. Find the mean and the standard deviation for the numbers of
peas with green pods in the groups of 40.
The value of the mean is mu 30 peas.
(Type an integer or a decimal. Do not round.)
N = 40
P = .75
u = 30
40 x .75 = 30
The value of the standard deviation is 2.7 peas.
 TI84 Plus Instructions TI84 Plus InstructionsQ = 1 - p = 1 - 0.75 = 0.25
√ (40 x .75 x .25) = 2.738612700 (sq. root)
b. Use the range rule of thumb to find the values separating
results that are significantly low or significantly high.
Values of 24.6 peas or fewer are significantly low.
30 – 2(2.7) = 24.6
Values of 35.4 peas or greater are significantly high.
30 + 2(2.7) = 35.4
c. Is a result of 6 peas with green pods a result that is
significantly low? Why or why not?
The result is significantly low,
because 6 peas with green pods is less than greater than 24.6
peas.
(Round to one decimal place as needed.)
Which of the following is not a requirement of the binomial
probability distribution?
Choose the correct answer below.
A. The probability of a success remains the same in all trials.
B. The trials must be dependent.
C. Each trial must have all outcomes classified into two
categories.
D. The procedure has a fixed number of trials.
In the binomial probability formula, the
variable x represents the ____.
number of successes
For the binomial distribution, which
formula finds the standard
deviation?
npq
np
√npq
√np
A main goal in statistics is to interpret and understand the
meaning of statistical values.
The ________ can be very helpful in understanding the meaning of
mean and standard deviation.
Range Rule of Thumb
Identify the expression for calculating the mean of a binomial
distribution.
np
Homework 6.1
A normal distribution is informally described as a probability
distribution that is "bell-shaped" when graphed. Draw a rough sketch
of a curve having the bell shape that is characteristic of a normal
distribution. Choose the correct answer below. A.

What requirements are necessary for a normal probability
distribution to be a standard normal probability distribution? Choose the
correct answer below.
A. The mean and standard deviation have the values of mu = 0 and sd = 1.
B. The mean and standard deviation have the values of mu = 1 and sd = 1.
C. The mean and standard deviation have the values of mu = 0 and sd = 0.
D. The mean and standard deviation have the values of mu = 1 and sd = 0.
What does the notation za indicate?
The expression za denotes the z score with an area of
to the right.
Find the area of the shaded region.
The graph depicts the standard normal distribution with mean 0 and standard deviation 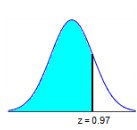 0.97
The area of the shaded region is 0.8340
(Round to four decimal places as needed.)
 TI84 Plus Instructions TI84 Plus Instructions2ND
VARS Normalcdf lower: -99999 upper: 0.97 u: 0 σ: 1
0.8339767602
Find the area of the shaded region. The graph depicts the standard
normal distribution of bone density scores with mean 0 and standard deviation
1.
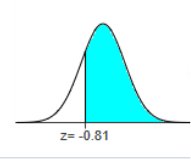 -0.81
The area under the curve to the right of the vertical line is
shaded.
The area of the shaded region is 0.7910
(Round to four decimal
places as needed.)
Left of the center (use 9999) and negative z score
 TI84 Plus Instructions TI84 Plus Instructions2ND
VARS Normalcdf Lower: 9999 Upper: -0.81 u: 0 σ: 1
Find the area of the shaded region. The graph depicts the standard
normal distribution of bone density scores
with mean 0 and standard deviation 1. 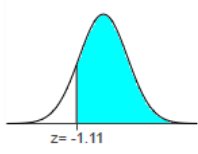 -1.11
The area of the shaded region is
(Round to four decimal places as needed.)

TI84 Plus Instructions
2ND
VARS
Normalcdf
-9999 1.11 0 1 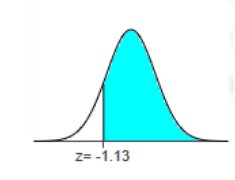
-1.13
The area
of the shaded region is 0.8708
(Round to
four decimal places as needed.)
Lower is negative
and upper is positive when the number is negative.
 TI84
Plus TI84
Plus2ND
VARS
Normalcdf
-9999
1.13 0 1 = 0.8707618393
Find the indicated z score. The graph depicts the standard normal distribution
with mean 0 and standard deviation 1.
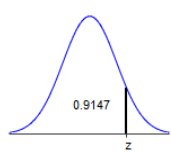
The indicated z score is 1.37
(Round to two decimal places as needed.)
 TI84 Plus Instructions TI84 Plus Instructions2ND
VARS
invNorm
Area: 0.9147 u: 0 σ: 1 = 1.370278443
Find the indicated z score. The graph depicts the standard normal
distribution with mean 0 and standard deviation 1.
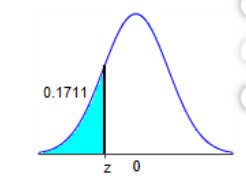
.1711 z 0
The indicated z score is -0.95
(Round to two decimal places as needed.)
 TI84 Plus Instructions TI84 Plus Instructions
2ND
VARS
invNorm
Area: 0.1711 u: 0 σ: 1 = -0.9498273216
Find the indicated z score. The graph depicts the standard normal
distribution with mean 0 and standard deviation 1.
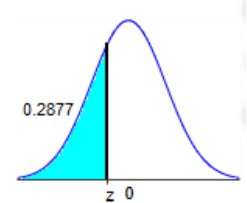
0.2877 Z0
The indicated z score is -0.56
(Round to two decimal places as needed.)
 TI84 Plus Instructions TI84 Plus Instructions2ND
VARS
invNorm
0.2877 0 1 = -0.560116461
Find the indicated z score.
The graph depicts the standard normal distribution with mean 0 and standard deviation 1. 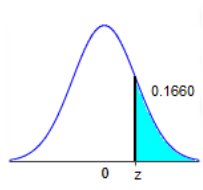
0 z 0.1660
The indicated z score is 0.97
(Round to two decimal places as needed.)
 TI84 Plus Instructions TI84 Plus Instructions2ND
VARS
invNorm
0.1660 0 1 = -0.9700932795
(remove negative because z score is to the right of the
center)
Find the area of the shaded region. The graph to the right depicts
IQ scores of adults, and
those scores are normally distributed with a mean of 100 and a standard deviation of 15. 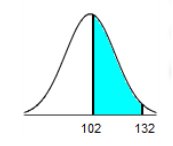 102 132
The area of the shaded region is 0.4317
(Round to four decimal places as needed.)
102 – 100 / 15 = .1333333333333 (0.13)
132 – 100 / 15 = 2.1333333333333 (2.13)
 TI84 Plus Instructions TI84 Plus Instructions2ND
VARS
Normalcdf
-9999 0.13 0 1 = 0.5517
2ND
VARS -9999 2.13 0 1 = 0.9834
0.9834 - 0.5517 = 0.4317
Assume that a randomly selected subject is given a bone density
test. Those test scores are normally distributed
with a mean of 0 and a standard deviation of 1. Find the probability that a given score is less than 2.22 and draw a sketch of the region. 
The probability is 0.9868
(Round to four decimal places as needed.)
 TI84 Plus Instructions TI84 Plus Instructions2ND VARS
-9999 2.22 0 1
= 0.9867906612
Assume that a randomly selected subject is given a bone density
test. Those test scores are normally distributed
with a mean of 0 and a standard deviation of 1. Find the probability that a given score is less than 1.63 and draw a sketch of the region. Sketch the region. Choose the correct graph below. 
The probability is 0.9484
(Round to four decimal places as needed.)
 TI84 Plus Instructions TI84 Plus Instructions2ND
VARS
Normalcdf
-9999 1.63 0 1
0.9484492628
Assume that a randomly selected subject is given a bone density
test. Those test scores are normally distributed
with a mean of 0 and a standard deviation of 1. Draw a graph and find the probability of a bone density test score greater than negative -1.83. Sketch the region. Choose the correct graph below

The probability is 0.9664
(Round to four decimal places as needed.)
Upper is positive because it’s to the left.
 TI84 Plus Instructions TI84 Plus Instructions2ND
VARS
Normalcdf
Lower: -9999 Upper: 1.83 u: 0 σ: 1
0.9663750893
Assume that thermometer readings are normally distributed with a
mean of 00 C and a standard deviation of 1.000 C.
A thermometer is randomly selected and tested. For the case below, draw a sketch, and find the probability of the reading. (The given values are in Celsius degrees.) Draw a sketch. Choose the correct graph below.
 The probability of getting a reading between 0.25 degrees and 1.00
degrees is .2426
(Round to four decimal places as needed.)
 TI84 Plus Instructions TI84 Plus Instructions2ND
VARS
Normalcdf
-9999 0.25 0 1
= 0.5987062744
2ND
VARS Normalcdf -9999 1.00 0 1
= 0.8413447404
0.8413447404 - 0.5987062744 = .242638466
Assume that a randomly selected subject is given a bone density
test. Those test scores are normally distributed
with a mean of 0 and a standard deviation of 1. Draw a graph and find the probability of a bone density test score greater than 0. Sketch the region. Choose the correct graph below.
 The probability is .5000
(Round to four decimal places as needed.)
 TI84 Plus Instructions TI84 Plus Instructions2ND
VARS
normalcdf
(-)9999
0
0
1
0.5000000005
Assume that the readings on the thermometers are normally
distributed with a mean of 00 degrees and standard deviation
of 1.000 C. A thermometer is randomly selected and tested. Draw a sketch and find the temperature reading corresponding to Upper P85, the 85th percentile. This is the temperature reading separating the bottom 85% from the top 15%.  The temperature for Upper P85 is approximately 1.040
(Round to two decimal places as needed.)
 TI84 Plus Instructions TI84 Plus Instructions2ND
VARS
invNorm
area: 0.85 u: 0 σ: 1
1.03643338
Assume that a randomly selected subject is given a bone density
test. Bone density test scores are normally
distributed with a mean of 0 and a standard deviation of 1. Draw a graph and find P3, the 3rd percentile. This is the bone density score separating the bottom 3% from the top 97 %.
Which graph represents P3 Choose the correct graph
below.

The bone density score corresponding to Upper P3 is -1.88
(Round to two decimal places as needed.)
 TI84 Plus Instructions TI84 Plus Instructions2ND
VARS
invNorm
0.03 0 1
-1.88079361
Assume that a randomly selected subject is given a bone density
test.
Those test scores are normally distributed with a mean of 0 and a standard deviation of 1. Draw a graph and find the bone density test scores that can be used as cutoff values separating the lowest 4% and highest 4%, indicating levels that are too low or too high, respectively.
Sketch the region. Choose the correct graph below

The bone density scores are -1.75, 1.75
(Use a comma to separate answers as needed. Round to two decimal
places as needed.)
 TI84 Plus Instructions TI84 Plus Instructions2ND
VARS
invNorm
0.04 0 1
-1.750686071, 1.750686071
Find the indicated critical value.
20.11
z0.11 = 1.23 positive number because
it’s minus 1
(Round to two decimal places as needed.)
 TI84
Plus TI84
Plus2ND VARS
invNorm
0.11 0 1
1.22652812
(positive because it’s minus 1)
Which of the following is NOT a descriptor of a normal
distribution of a random variable?
Choose the correct answer below.
A. The graph of the distribution is symmetric.
B. The graph is centered around the mean.
C. The graph of the distribution is bell-shaped.
D. The graph is centered around 0.
Which of the following groups of terms can be used interchangeably
when working with normal distributions?
Choose the correct answer below.
areas, z-scores, and relative frequencies
areas, probability, and relative frequencies
z-scores, probability, and relative frequencies
areas, z-scores, and probability
Which of the following does NOT describe the standard normal distribution? Choose the correct answer below.
A. It is a
normal distribution with a mean of 0 and a standard deviation of 1.
B. The
total area under the curve must equal 1.
C. The
graph is symmetric.
D. The
graph is uniform.
Finding probabilities associated with distributions that are
standard normal distributions is equivalent to
finding the area of the shaded region representing that
probability
the notation P(z <
a) denotes
the probability that the z-score is less than
a
Homework 6.2
Pulse rates of women are normally distributed with a mean of 77.5
beats per minute and a standard deviation of
11.6 beats per minute. Answer the following questions. What are the values of the mean and standard deviation after
converting all pulse rates of women to z scores using.
z = x - u / σ
u = 0
σ = 1
The original pulse rates are measure with units of "beats
per minute".
What are the units of the corresponding z scores? Choose the correct choice below.
A. The z scores are measured with units of "beats."
B. The z scores are measured with units of "minutes per
beat."
C. The z scores are measured with units of "beats per
minute."
D. The z scores are numbers without units of measurement.
Find the
area of the shaded region. The graph to the right depicts IQ scores of adults,
and those scores are
normally distributed with a mean of 100 and a standard deviation of 15. 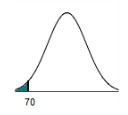
70
The area
of the shaded region is 0.0228
(Round to
four decimal places as needed.)
Use
the NEGATIVE on ti84.
70
– 100 / 15 = -2
 TI84 Plus Instructions TI84 Plus Instructions2ND
VARS
Normalcdf
Lower: -9999 Upper: -2 u: σ: 0
.022750062
Find the area of the shaded region. The graph to the right depicts
IQ scores of adults, and those scores are normally
distributed with a mean of 100 and a standard deviation of 15. 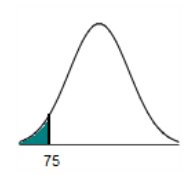
The area of the shaded region is -1.67 (Round to four decimal places
as needed.)
75 – 100 / 15 = -1.666666 (-1.67)
Find the area of the shaded region. The graph to the right depicts
IQ scores of adults, and those scores are normally
distributed with a mean of 100 and a standard deviation of 15 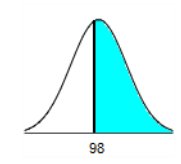
98
The area of the shaded region is 0.5517
(Round to four decimal places as needed.)
98 – 100 / 15 = -.13
 TI84 Plus Instructions TI84 Plus Instructions2ND VARS
Lower: -9999 Upper: 0.13 (positive number because it’s on the left) u: 0 σ: 1
.5517168235
Find the area of the shaded region. The graph to the right depicts
IQ scores of adults, and those scores are normally
distributed with a mean of 100 and a standard deviation of 15. 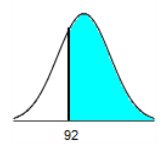
The area of the shaded region is 0.7019 (Round to four
decimal places as needed.)
92 – 100 / 15 = .533333 (-0.53)
 TI84 Plus Instructions TI84 Plus Instructions
2ND VARS
-9999 0.53 0 1
= 0.7019440569
The indicated IQ score, x, is 98.1
(Round to one decimal place as needed.)
1 - 0.55 = .45
 TI84 Plus Instructions TI84 Plus Instructions
2ND VARS
0.45, 0, 1 = -0.1256613375 (-0.13)
100
+ (-.13 x 15) = 98.05 (98.1)
Find the
area of the shaded region. The graph to the right depicts IQ scores of adults,
and those scores are normally
distributed with a mean of 100 and a standard deviation of 15. 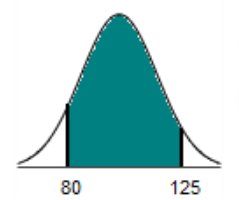
80
125
The area
of the shaded region is 0.8607
(Round to
four decimal places as needed.)
125 – 100 / 15 = 1.67
 TI84 Plus Instructions TI84 Plus Instructions2ND VARS
-9999 -1.33 0 1 = 0.0917591981 (round to 4 decimals) .0918
2ND VARS
-9999 1.67 0 1 = 0.952540341 (round to 4 decimals (.9525)
0.9525 - 0.0918 = 0.8607
Find the area of the shaded region. The graph to the right depicts
IQ scores of adults, and those scores are normally
distributed with a mean of 100 and a standard deviation of 15  80 125
The area of the shaded region is 0.7938 (Round to four
decimal places as needed.)
85 – 100 / 15 = -1.00
125 – 100 / 15 = 1.67
 TI84 Plus Instructions TI84 Plus Instructions
2ND VARS
-9999 -1.33 0 1 = 0.1586552596 (round to 4 decimals) (0.1587)
2ND VARS
-9999 1.67 0 1 = 0.952540341 (round to 4 decimals (0.9525)
0.9525 - 0.1587 = 0.7938
Find the area of the shaded region. The graph to the right depicts
IQ scores of adults, and those scores are normally
distributed with a mean of 100 and a standard deviation of 15. 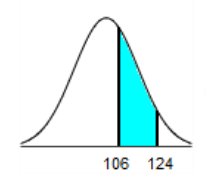
106 124
The area of the shaded region is 0.2898
106 – 100 / 15 = 0.400
124 – 100 / 15 = 1.60
 TI84 Plus Instructions Instructions TI84 Plus Instructions Instructions2ND VARS
-9999 .4 0 1 = .6554216971 (round to 4 = 0.6554)
2ND VARS
-9999 1.60 0 1 = .9452007106 (round to 4 decimals 0.9452)
0.9452 - 0.6554 = 0.2898
Find the indicated IQ score. The graph to the right depicts IQ
scores of adults, and those scores are normally
distributed with a mean of 100 and a standard deviation of 15. 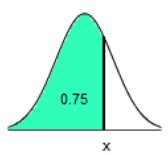 0.75
The indicated IQ score, x, is 110.1
 TI84 Plus Instructions TI84 Plus Instructions
2ND VARS
area: 0.75 u: 0 σ: 1
= 0.6744897495
100 + (.67 x 15) = 110.05
Find the indicated IQ score. The graph to the right depicts IQ
scores of adults, and those scores are
normally distributed with a mean of 100 and a standard deviation of 15. 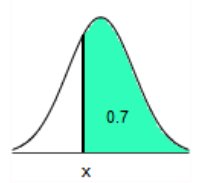
x 0.7
The indicated IQ score, x, is 92.2
1 - 0.7 = .3
 TI84 Plus Instructions TI84 Plus InstructionsPress 2ND VARS
area: 0.3 u: 0 σ: 1
= -0.5244005101
100 + (-0.52 x 15) = 92.2
Assume that adults have IQ scores that are normally distributed with a mean of mu equals 105 and a standard deviation sigma equals 20. Find the probability that a randomly selected adult has an IQ less than 129.
The
probability that a randomly selected adult has an IQ less than 129 is 0.8849
(Type an
integer or decimal rounded to four decimal places as needed.)
129
– 105 / 20 = 1.2
 TI84 Plus Instructions TI84 Plus Instructions2ND VARS
Lower: -9999 Upper: 1.2 u: 0 σ: 1
= 0.8849302684
Assume that adults have IQ scores that are normally distributed
with a mean of 96.5 and a standard
deviation of 20.7.
Find the probability that a randomly selected adult has an IQ greater than 134.6 (Hint: Draw a graph.)
The probability that a randomly selected adult from this group has
an IQ greater than 134.6 is .0329
(Round to four decimal places as needed.)
134.6 – 96.5 / 20.7 = 1.84057971
 TI84 Plus Instructions TI84 Plus InstructionsPress 2ND | VARS
Normalcdf
Lower: 9999
Upper: 1.84
Mu: 0
SD: 1
= -.0328840585 (remove negative)
Assume that adults have IQ scores that are normally distributed
with a mean of mu equals 105 and a
standard
deviation sigma equals 15 . Find the probability that a randomly selected adult has an IQ between 92 and 118
The probability that a randomly selected adult has an IQ between
92 and 118 is .6156
(Type an integer or decimal rounded to four decimal places as
needed.)
92 - 105 / 15 = -0.86666666667 (-0.87)
116 - 105 / 15 = 0.733333333333 (0.73)
 TI84 Plus Instructions TI84 Plus Instructions2ND VARS
-9999 -0.87 0 1 = 0.1921501574
2ND VARS
-9999 0.73 0 1 = 0.767304982
.8078 - .1922 = .6156
Assume that adults have IQ scores that are normally distributed
with a mean of mu equals 105 and a standard
deviation sigma equals 15. Find the probability that a randomly selected adult has an IQ between 86 and 124.
The probability that a randomly selected adult has an IQ between
86 and 124 is 0.7960
(Type an integer or decimal rounded to four decimal places as
needed.)
86 – 105 / 15 = -1.26666666667
124 – 105 / 15 = 1.26666666666
 TI84 Plus Instructions TI84 Plus Instructions2ND VARS
-9999 -1.27 0 1 = .1020423807
2ND VARS
-9999 0.127 0 1 = 0.8979576193
0.8980 - 0.1020 = 0.7960
Engineers want to design seats in commercial aircraft so that they
are wide enough to fit 90% of all males
(Accommodating 100% of males would require very wide seats that would be much too expensive.) Men have hip breadths that are normally distributed with a mean of 14.9 in. and a standard deviation of 1.1 in. Find Upper P90. That is, find the hip breadth for men that separates the smallest 90% from the largest 10 %.
The hip breadth for men that separates the smallest 90% from the
largest 10% is Upper P90 = 16.3 in.
(Round to one decimal place as needed.)
 TI84 Plus Instructions TI84 Plus Instructions
2ND VARS
0.9 0 1 = 1.28155
14.9 + (1.28 x 1.1) = 16.308
A survey found that women's heights are normally distributed with
mean 63.9 in and standard deviation
2.2 in.
A branch of the military requires women's heights to be between 58 in and 80 in.
a. The percentage of women who meet the height requirement is 99.63%.
(Round to two decimal places as needed.)
58 – 63.9 / 2.2 = -2.68181818182 (-2.68)
80 – 63.9 / 2.2 = 7.31818181818 (7.31)
 TI84 Plus Instructions TI84 Plus Instructions2ND VARS
-9999 -2.68 0 1 = 0.0036811545 (.0037) rounded to 4 decimals
2ND VARS
-9999 7.31 0 1 = 1.0000
1.0000- .0037 = .9963 (99.63%)
Are many women being denied the opportunity to join this branch of
the military because they are too short or too tall?
Yes, because the percentage of women who meet the height
requirement is fairly large.
No, because only a small percentage of women are not allowed
to join this branch of the military because of their height.
Yes, because a large percentage of women are not allowed to
join this branch of the military because of their height.
No, because the percentage of women
who meet the height requirement is fairly small.
For the new height requirements, this branch of the military
requires women's heights to be at least 58.8 in. and at most 68.4
in.
(Round to one decimal place as needed.)
As specified in the problem statement, the shortest 1% will be
rejected with the new height requirements.
To find the new minimum height requirement, use technology to find the z score with 1% of the total area under the standard normal curve to its left  TI84 Plus Instructions TI84 Plus Instructions2ND VARS
0.01 0 1 = -2.326347877 (-2.33)
63.9 + (-2.33 x 2.2) = 58.774
Use similar steps to find the new maximum height. First find the z
score with 2% of the total area under the standard
normal curve to its right or 100% - 2% = 98% of the total area under the standard normal curve to its left.  TI84 Plus Instructions TI84 Plus Instructions2ND VARS
0.98 0 1 = 2.053748911 (2.05)
63.9 + (2.05 x 2.2) = 68.41
The lengths of pregnancies are normally distributed with a mean of
267 days and a standard deviation of 15 days.
a. Find the probability of a pregnancy lasting 307 days or longer.
b. If the length of pregnancy is in the lowest 3%, then the baby
is premature. Find the length that separates premature
babies from those who are not premature
a. The probability that a pregnancy will last 307 days or longer
is .0038
307 – 267 / 15 = 2.6666666667 (2.67)
 TI84 Plus Instructions TI84 Plus Instructions2ND VARS
-9999 2.67 0 1 = 0.9962073926
1 - 0.9962 = 0.0038
Babies who are born on or before 239 days are considered
premature.
(Round to the nearest integer as needed.)
Area closest to 3% is 0.0301
 TI84 Plus Instructions TI84 Plus Instructions2ND VARS
0.03 0 1
= -0.1.879 (-1.88)
267 + (-1.88 x 15) = 238.8 (round to 239)
The lengths of pregnancies are normally distributed with a mean of
267 days and a standard deviation of 15
days.
a. Find the probability of a pregnancy lasting 308 days or longer.
b. If the length of pregnancy is in the lowest 4 %, then the baby
is premature.
Find the length that separates premature babies from those who are not premature.
The probability that a pregnancy will last 308 days or longer is 0.0032
(Round to four decimal places as needed.)
308 – 267 / 15 = 2.7333333333 (2.73)
 TI84 Plus Instructions TI84 Plus Instructions2ND VARS
-9999 2.73 0 1 = 0.9968332307 (0.9968)
1 - 0.9968 = 0.0032
Babies who are born on or before 241 days are considered
premature.
(Round to the nearest integer as needed.)
Area closest to 4% is 0.0401
 TI84 Plus Instructions TI84 Plus InstructionsPress: 2ND VARS
area: 0.0401 (0.04 + 0.001) u: 0 σ: 1
-1.749526802
267 + (-1.75 x 15) = 240.75 (round to 241)
Which of the following is not true?
Choose the correct answer below.
A. A z-score is a conversion that standardizes any value from a
normal distribution to a standard normal distribution.
B. If values are converted to standard z-scores, then procedures
for working with all normal distributions are the same
as those for the standard normal distribution.
C. The area in any normal distribution bounded by some score x is
the same as the area bounded by the equivalent
z-score in the standard normal distribution.
D. A z-score is an area under the normal curve.
Where would a value separating the top 15% from the other values
on the graph of a normal distribution be found?
Choose the correct answer below.
A. the left side of the horizontal scale of the graph
B. the center of the horizontal scale of the graph
C. the right side of the horizontal scale of the graph
D. on the top of the curve
What conditions would produce a negative z-score? Choose the
correct answer below.
A. a z-score for a negative area
B. a z-score corresponding to an area located entirely in the
left side of the curve
C. an area in the top 10% of the graph
D. a z-score corresponding to an area located entirely in the
right side of the curve
Complete the following statement.
If you are asked to find the 85th percentile, you are being asked
to find _____.
Choose the correct answer below.
A. a data value associated with an area of 0.85 to its left.
B. an area corresponding to a z-score of 0.85.
C. a data value associated with an area of 0.85 to its right.
D. an area corresponding to a z-score of -0.85.
Homework: Chapter 5, 6.2, 6.3
Review Homework
Determine whether the value is a discrete random variable,
continuous random variable, or not a random variable.
a. The number of hits to a website in a day number of hits to a
website in a day
b. The number of statistics students now reading a book number of
statistics students now reading a book
c. The response to the survey question "Did you smoke in the
last week question mark "response to the survey question
"Did you smoke in the last week?"
d. The number of people with blood type Upper A in a random sample
of 22 people number of people with blood
type A in a random sample of 22 people
e. The time it takes to fly from City Upper A to City Upper B time
it takes to fly from City A to City B
f. The number of points scored during a basketball game number of
points scored during a basketball game
Is the number of hits to a website in a day number of hits to a
website in a day a
discrete random variable,
a continuous random variable, or not a random variable?
A. It is a discrete random variable.
B. It is a continuous random variable.
C. It is not a random variable.
Is the number of statistics students now reading a book number of
statistics students now reading a book a discrete
random variable, a continuous random variable, or not a random variable?
A. It is a continuous random variable.
B. It is a discrete random variable.
C. It is not a random variable
Is the response to the survey question "Did you smoke in the
last week question mark "response to the survey question
"Did you smoke in the last week?"
a discrete random variable, a continuous random variable, or not
a random variable?
A. It is a discrete random variable.
B. It is a continuous random variable.
C. It is not a random variable.
Is the number of people with blood type Upper A in a random sample
of 22 people number of people with blood type A
in a random sample of 22 people
A. It is a continuous random variable.
B. It is a discrete random variable.
C. It is not a random variable.
Is the time it takes to fly from City Upper A to City Upper B time
it takes to fly from City A to City B a discrete random variable, a continuous
random variable, or not a random variable?
A. It is a discrete random variable.
B. It is a continuous random variable.
C. It is not a random variable.
Is the number of points scored during a basketball game number of
points scored during a basketball game a
discrete random variable, a continuous random variable, or not a random variable?
A. It is a discrete random variable.
B. It is a continuous random variable.
C. It is not a random variable.
Ted is not
particularly creative. He uses the pickup line "If I could rearrange the
alphabet, I'd put U and I together."
The random variable x is the number of women Ted approaches before encountering one who reacts positively. Determine whether a probability distribution is given. If a probability distribution is given, find its mean and standard deviation. If a probability distribution is not given, identify the requirements that are not satisfied.
x P(x)
0 0.001
1 0.007
2 0.031
3 0.061
Total = .01
Does the
table show a probability distribution? Select all that apply.
A. Yes,
the table shows a probability distribution.
B. No,
the random variable x's number values are not associated with probabilities.
C. No,
the random variable x is categorical instead of numerical.
D. No,
the sum of all the probabilities is not equal to 1.
E. No,
not every probability is between 0 and 1 inclusive.
Find the
mean of the random variable x. Select the correct choice below and, if
necessary,
fill in the answer box to complete your choice.
A. mu =
women (Round to one decimal place as needed.)
B. The
table does not show a probability distribution.
Find the
standard deviation of the random variable x. Select the correct choice below
and, if necessary,
fill in the answer box to complete your choice.
A. sd = women (Round to one decimal place as needed.)
B. The
table does not show a probability distribution.
Determine whether the given procedure results in a binomial
distribution. If it is not binomial, identify the requirements
that are not satisfied.
Choose the correct answer below.
A. No, because there are more than two possible outcomes and the trials are not independent.
B. Yes comma because all 4 requirements are satisfied.
C. No, because the probability of
success does not remain the same in all trials.
D. No because there are more than two possible outcomes.
Determine whether the given procedure results in a binomial
distribution (or a distribution that can be treated as binomial).
If the procedure is not binomial, identify at least one requirement that is not satisfied.
The YSORT method of gender selection, developed by the Genetics
& IVF Institute, was designed to
increase the likelihood that a baby will be a boy. When 60 couples use the YSORT method and give birth to 60 babies, the genders of the babies are recorded.
Does the procedure represent a binomial distribution?
A. No, because the probability of success differs from trial to
trial.
B. No, because the trials of the
procedure are not independent.
C. Yes, because the procedure satisfies
all the criteria for a binomial distribution.
D. No, because there are more than two
categories for each trial.
The accompanying table describes results from groups of 10 births
from 10 different sets of parents.
The random variable x represents the number of girls among 10 children. Use the range rule of thumb to determine whether 1 girl in 10 births is a significantly low number of girls. Number of Girls x P(x)
0 0.001
1 0.012
2 0.041
3 0.112
4 0.203
5 0.247
6 0.209
7 0.113
8 0.042
9 0.015
10 0.005
Use the range rule of thumb to identify a range of values that are
not significant.
The maximum value in this range is girls. 8.2
(Round to one decimal place as needed.)
# of Girls x P(x)
X
x P(x)
(x-mu)^2xP(x)
0 0.001 x 0
(0-5)2 x 0.001 0.025
1 0.012 x
0.012 (1-5)
2 x 0.012 0.192
2 0.041 x
0.082 (2-5)
2 x 0.041 0.369
3 0.112 x
0.336 (3-5)
2 x 0.112 0.448
4 0.203 x
0.812 (4-5)
2 x 0.203 0.203
5 0.247 x
1.235 (5-5)
2 x 0.247 0
6 0.209 x
1.254 (6-5)
2 x 0.209 0.209
7 0.113 x
0.791 (7-5)
2 x 0.113 0.452
8 0.042 x
0.336 (8-5)
2 x 0.042 0.378
9 0.015 x
0.135 (9-5)
2 x 0.015 0.24
10 0.005 x
0.05 (10-5)
2 x 0.005 0.125
PrintDone 5.043
variance = 2.641 = sd = sq root
sd 1.62511 (1.6)
maximum = u + 2(σ)
5 + 2(1.6) = 8.2
The minimum value in this range is 1.8 girls.
(Round to one decimal place as needed.)
minimum = u - 2(σ)
5 – 2(1.6) = 1.8
Based on the result, is 1 girl in 10 births a significantly low
number of girls? Explain.
A. No, 1 girl is not a significantly low number of girls,
because 1 girl is within the range of values that are not significant.
B. Yes, 1 girl is a significantly low number of girls, because 1
girl is above the range of values that are not significant.
C. Yes, 1 girl is a significantly low number of girls, because 1
girl is below the range of values that are not significant.
D. Not enough information is given.
Based on
a survey, assume that 44% of consumers are comfortable having drones deliver
their purchases.
Suppose that we want to find the probability that when five consumers are randomly selected, exactly two of them are comfortable with delivery by drones. Identify the values of n, x, p, and q.
The value
of n is five (5)
(Type an
integer or a decimal. Do not round.)
The value
of x is two (2)
(Type an
integer or a decimal. Do not round.)
The value
of p is .44
(Type an
integer or a decimal. Do not round.)
The value
of q is .56
(Type an
integer or a decimal. Do not round.)
1
- .44 = .56
A pharmaceutical company receives large shipments of aspirin
tablets.
The acceptance sampling plan is to randomly select and test 36 tablets, then accept the whole batch if there is only one or none that doesn't meet the required specifications. If one shipment of 3000 aspirin tablets actually has a 6% rate of defects, what is the probability that this whole shipment will be accepted? Will almost all such shipments be accepted, or will many be rejected?
The probability that this whole shipment will be accepted is .3555
(Round to four decimal places as needed.)
 TI84 Plus Instructions TI84 Plus Instructions
Press: 2ND
36 0.06 1
= 0.3554975158 (.3555)
The company will accept 35.55% of the shipments and will
reject 64.45% of the shipments, so many of the shipments will be
rejected.
.3555 x 100 = 35.55%
100% - 35.55% = 64.45%
Find the area of the shaded region. The graph depicts the standard
normal distribution with mean 0 and standard deviation 1.
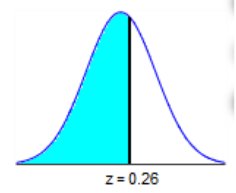 z = 0.26
The area of the shaded region is 0.6025680579
 TI84 Plus Instructions TI84 Plus Instructions
Press 2ND VARS
-9999 0.26 0 1 =
Find the indicated z score. The graph depicts the standard normal distribution
with mean 0 and standard deviation 1.
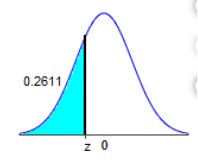 The indicated z score is -0.64
 TI84 Plus Instructions TI84 Plus InstructionsPress 2ND VARS
0.2611 0 1 = -0.6399578503
Find the indicated z score. The graph depicts the standard normal
distribution with mean 0 and standard deviation 1.
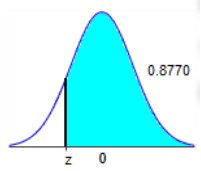 z 0 0.8770 The indicated z score is -0.16
(Round to two decimal places as needed.)
1 - 0.8770 = 0.123
 TI84 Plus Instructions TI84 Plus InstructionsPress 2ND VARS
0.123 0 1
= -1.160119882
Assume that a randomly selected subject is given a bone density
test.
Those test scores are normally distributed with a mean of 0 and a standard deviation of 1. Find the probability that a given score is less than -0.72 and draw a sketch of the region. Sketch the region.

The probability is 0.2358
(round to 4 decimal place)
 TI84 Plus Instructions TI84 Plus InstructionsPress 2ND VARS Normalcdf
lower: (-)9999
upper: -0.72 u: 0 σ: 1
= 0.2357624233
Assume
that a randomly selected subject is given a bone density test.
Bone density test scores are normally distributed with a mean of 0 and a standard deviation of 1. Draw a graph and find Upper P7, the 7th percentile. This is the bone density score separating the bottom 7% from the top 93 %. Which graph represents Upper P7 Choose the
correct graph below.

The bone
density score corresponding to Upper P7 is -1.48
(Round to
two decimal places as needed.)
P7 = .07
 TI84 Plus Instructions TI84 Plus Instructions
2nd VARS
0.07
Find the area of the shaded region. The graph to the right depicts
IQ scores of adults,
and those scores are normally distributed with a mean of 100 and a standard deviation of 15. 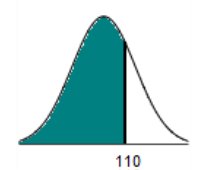 110
The area of the shaded region is 0.7486
(Round to four decimal places as needed.)
110 – 100 / 15 = .6666666666667 (.67)
 TI84 Plus Instructions TI84 Plus Instructions
2nd VARS
Lower: -9999
Upper: .67
u: 0
σ: 1
= 0.748571176
|
| Home |
Accounting & Finance | Business |
Computer Science | General Studies | Math | Sciences |
Civics Exam |
Everything
Else |
Help & Support |
Join/Cancel |
Contact Us |
Login / Log Out |
